

Egypt in TTDI 2026: Turning Price Competitiveness into Sustainable Tourism Value
Egypt in TTDI 2026: Turning Price Competitiveness into Sustainable Tourism Value
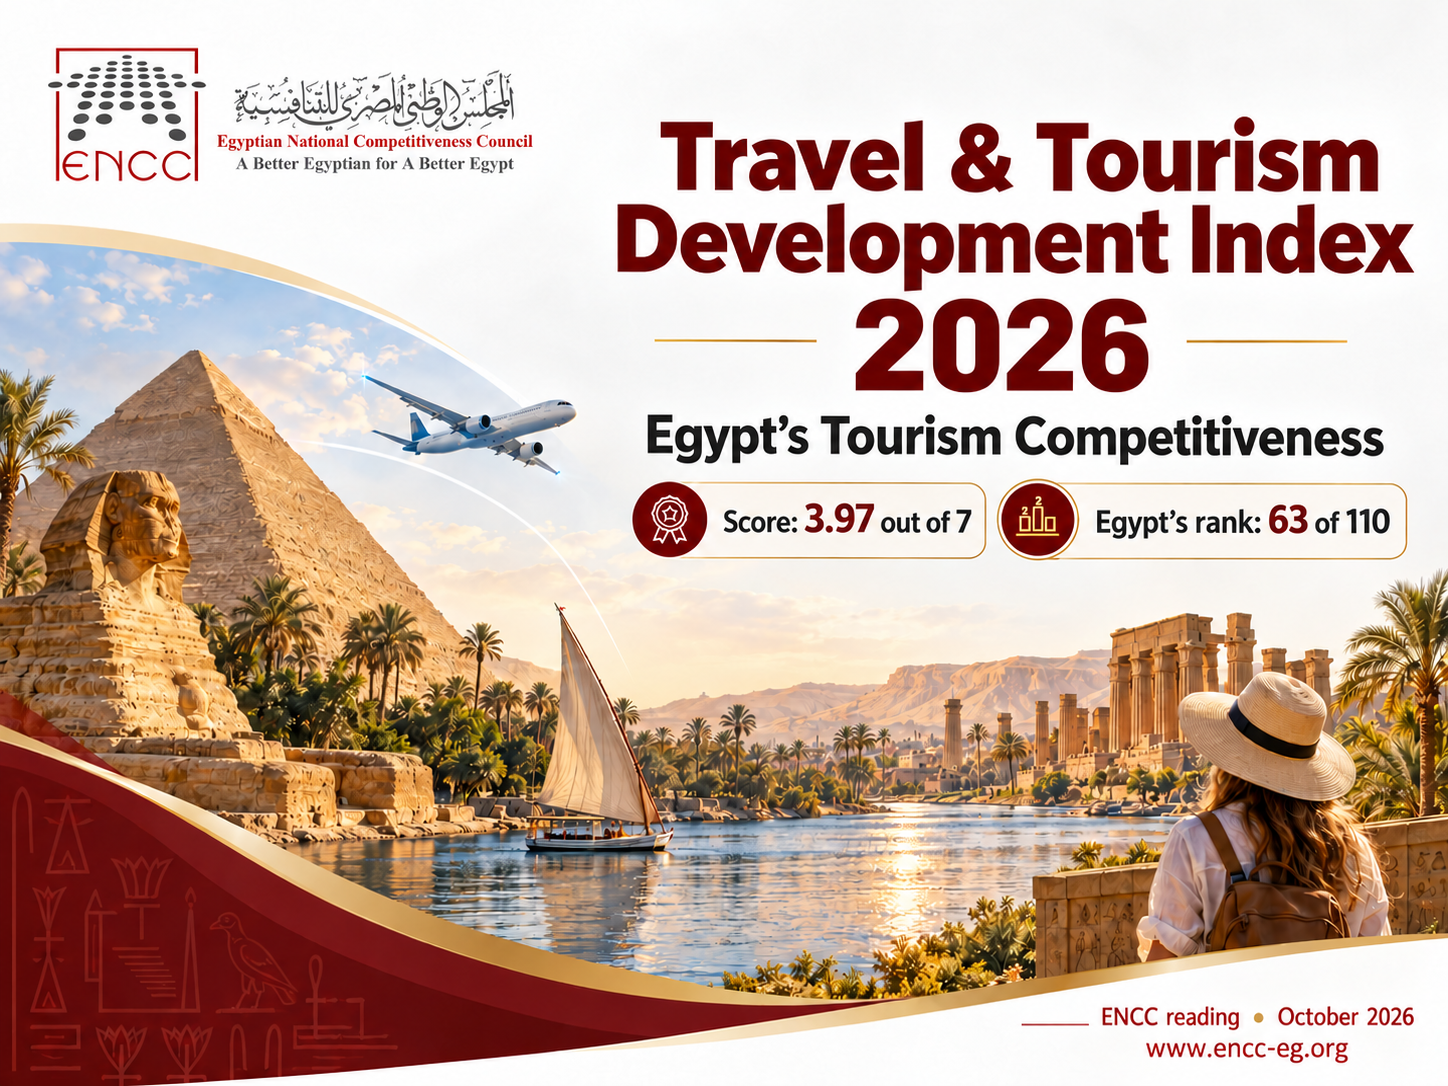
Egypt ranks 63 of 110 with a score of 3.97 in TTDI 2026, improving 2.1% against recalculated 2024. This ENCC reading examines price leadership, regional benchmarks and missing country pillar data, and proposes priorities for services, resilience and tourism value.
Egypt ranks 63 rd among 110 economies in the World Economic Forum's Travel & Tourism Development Index 2026, with a score of 3.97 out of 7. Its score rose by 2.1% against the 2024 results recalculated for this edition, while its position fell by two places. The same report identifies Egypt as the top-ranked economy for Price Competitiveness. Together, these findings point to an opportunity: use an established price advantage to support better services, stronger resilience and wider economic benefits, while examining the conditions that the overall result cannot explain on its own.
1. The main findings and their meaning
The headline is a combination of improvement and continuing competitive pressure. A higher score records progress in the conditions measured by the index; a lower rank shows that progress did not translate into a stronger position in the ordering of the economies covered. Neither number, by itself, measures tourism receipts, visitor satisfaction or the contribution of a particular Egyptian policy.
| Measure | Value | Basis |
|---|---|---|
| Overall score | 3.97 / 7 | 2026 edition |
| World rank | 63 / 110 | Economies covered in 2026 |
| Score change since 2024 | +2.1% | 2024 baseline recalculated in 2026 |
| Rank change since 2024 | -2 | Places; recalculated baseline |
| Score change since 2019 | +7.1% | 2019 baseline recalculated in 2026 |
| Rank change since 2019 | +7 | Places; recalculated baseline |
| Price Competitiveness | Top-ranked | Publisher label; no numerical Egyptian pillar score supplied |
Source: WEF, TTDI 2026, p 24, Figure 7; price leadership p 21, Figure 6. Positive rank change indicates improvement; negative indicates a decline.
Three distinctions guide this ENCC reading. Price competitiveness is a specific strength, rather than evidence of strength across every pillar. Regional averages provide context, rather than an estimate of Egypt's missing pillar scores. Historical change must come from the recalculated series accompanying the 2026 edition, rather than a direct calculation between the originally published 2024 and 2026 scores. These distinctions keep the analysis useful without assigning more precision or explanatory power to the index than its evidence supports.
2. The edition, its timing and its purpose
The World Economic Forum published the report on 25 September 2026 in collaboration with Zurich Insurance Group. Its framework draws on the Forum's longer tourism benchmarking programme and the transition from the earlier Travel & Tourism Competitiveness Index to a broader development perspective. ENCC's role here is to interpret the report for an Egyptian competitiveness audience; this reading does not imply a partnership with the publisher or its collaborators.
The edition year and data window serve different purposes. The results use the latest data available at collection in May 2026. Some individual indicators refer to earlier years and may differ in reference period across economies. The report's narrative also discusses risks and developments that should not be confused with a simultaneous measurement of every indicator. A reform or investment completed after the data window may therefore be absent from the score, even when relevant to current policy.
3. What the index measures
TTDI measures the factors and policies that enable sustainable and resilient tourism development. It examines the environment in which a destination can attract visitors, support activity and sustain its benefits. It does not directly rank economies by arrivals, spending or tourism revenue. Growth in these outcomes can coexist with weaknesses in the conditions that support them, just as improved enabling conditions may take time to produce visible results.
The framework comprises five dimensions, 17 pillars and 102 indicators. Enabling Environment covers business conditions, safety, health, labour and digital readiness. Tourism policy covers prioritization, openness and prices. Infrastructure and Services addresses air transport, ground and port connections, and tourist services. Resources covers natural, cultural and non-leisure attractions. Sustainability covers environmental conditions, socioeconomic benefits and the sustainability of demand. The five dimensions organize presentation; they are not five separately weighted components in the calculation of the overall score.
4. How to read the methodology
Most indicators are quantitative measures from international organizations, public datasets and private providers. The remainder draw on the Forum's Executive Opinion Survey where comparable statistical information is limited. Values are normalized to a common scale from 1, the worst outcome, to 7, the best. Aggregation proceeds through indicators and pillars using arithmetic means; the technical methodology explains the applicable treatment of subpillars and missing values.
This construction supports structured comparison, but its limitations matter. A composite score can combine strengths and weaknesses that require different responses. Perception measures and statistical series have different characteristics, and imputation helps coverage without removing uncertainty. Rounded published values should not be treated as exact underlying estimates. Consequently, a small gap is a prompt for investigation, rather than proof of a statistically meaningful difference or a reliable estimate of the cost of a policy failure.
5. What is available for Egypt
The PDF provides Egypt's overall score, world rank and reported changes against recalculated historical results. It also names Egypt as the leading economy in Price Competitiveness. The regional table provides numerical pillar averages for the publisher's groups, including the Middle East and North Africa and North Africa.
The material examined does not provide a complete numerical vector of Egypt's 17 pillar scores. That gap cannot be filled with regional averages, the position of a neighbouring economy or the colour of a regional heatmap. This report therefore offers a precise headline reading, a confirmed pillar strength and a structured framework for deeper diagnosis. It does not claim to reproduce Egypt's complete country profile or all 102 underlying indicator values. Obtaining those data through an appropriate official source would enable a more specific allocation of priorities.
6. A stronger global setting with concentrated leadership
The report describes a sector moving beyond recovery, with 1.5 billion international tourist arrivals in 2025. Within the recalculated TTDI comparison, 92% of ranked economies improved their score between 2024 and 2026, and the average score increased by 2.1%. These are global findings reported by the publisher, rather than measures of Egyptian arrivals or revenue.
| Rank | Economy | Score out of 7 |
|---|---|---|
| 1 | Japan | 5.27 |
| 2 | United States | 5.23 |
| 3 | Spain | 5.22 |
| 4 | Australia | 5.18 |
| 5 | France | 5.17 |
| 6 | Germany | 5.09 |
| 7 | United Kingdom | 5.08 |
| 8 | China | 5.00 |
| 9 | Switzerland | 4.97 |
| 10 | Italy | 4.93 |
Source: WEF, TTDI 2026, p 24, Figure 7. Ranking universe:110 economies.
Japan leads the ranking. Nine of the top ten positions belong to advanced economies, with China the exception identified by the report. The leading group illustrates the importance of accumulated infrastructure, service capacity and enabling systems alongside tourism assets. It should not be read as a single development model that every destination can copy. Economies differ in their markets, resource bases, income levels and institutional arrangements; useful learning focuses on specific practices and constraints rather than a target rank alone.
7. Growth is accompanied by affordability and benefit pressures
Global gains are uneven across the pillars. Cultural Resources, Tourist Services and Infrastructure, and Air Transport Infrastructure recorded reported average improvements of 9.6%, 9.2% and 7.2% respectively. Price Competitiveness fell by 3.1%, while T&T Socioeconomic Impact declined by 3.5%. Ground and Port Infrastructure showed no change at the displayed precision. Fourteen of the 17 pillars improved overall.
The pattern helps explain why expanding activity is an incomplete policy objective. The publisher reports persistent investment and workforce gaps, and warns that greater tourism activity is not automatically producing broader benefits. Demand Sustainability improved by 2.3% in the recent comparison, but the report still identifies challenges in managing concentration and seasonality. This recent improvement should not be described as a decline merely because sustainability concerns remain. For Egypt, the relevant question is how to translate demand into productive capacity and shared value while limiting pressures on destinations.
8. Why Egypt's score can rise while its rank falls
Egypt's 3.97 score and 2.1% improvement describe its measured result within the 2026 framework. Its rank also depends on the outcomes and ordering of other covered economies. Relative movements, revisions and coverage can affect that ordering. The headline result alone cannot establish which particular factor caused the two-place decline or assign responsibility to an institution.
The comparison with recalculated 2019 results tells a different, longer-term story: the publisher records a seven-place improvement and a 7.1% score increase. These figures can coexist with a weaker ranking position in the latest comparison. They describe different reference intervals, not contradictory evaluations. A sound assessment keeps both intervals visible and then examines the underlying indicators, their timing and the policies capable of influencing them.
9. Egypt in the regional picture
| Publisher region | Mean score out of 7 | Score change |
|---|---|---|
| Europe and Eurasia | 4.39 | +1.8% |
| Asia-Pacific | 4.29 | +3.6% |
| Middle East and North Africa | 3.98 | +2.5% |
| The Americas | 3.96 | +1.6% |
| Sub-Saharan Africa | 3.36 | +1.1% |
Source: WEF, TTDI 2026, p 29, Figure 11. Relative score change uses 2024 recalculated in 2026; figures are not percentage-point differences.
MENA's average score is 3.98, close to Egypt's 3.97 at the published precision. The North Africa average is 3.74. ENCC's simple differences between these displayed values place Egypt 0.01 index points below MENA and 0.23 points above North Africa. These are arithmetic comparisons of rounded scores, not percentage changes, publisher-assigned gaps or tests of statistical significance. Egypt is itself a member of both groups, so neither benchmark is an independent control group.
MENA's reported score improvement of 2.5% exceeds Egypt's reported 2.1% improvement over the recalculated 2024 baseline. The region is nevertheless diverse. Its average does not identify the Egyptian pillars responsible for the difference, nor does it make every regional economy an equally suitable comparator. The classification and composition supplied by the publisher should remain visible when benchmarks are used.
10. Learning from selected economies
| Economy | World rank | Score out of 7 | Score change since 2024 |
|---|---|---|---|
| United Arab Emirates | 22 | 4.56 | +0.5% |
| Saudi Arabia | 29 | 4.45 | +3.4% |
| Qatar | 47 | 4.23 | +6.0% |
| Oman | 62 | 3.98 | +2.9% |
| Egypt | 63 | 3.97 | +2.1% |
| Morocco | 70 | 3.84 | +5.5% |
| Jordan | 73 | 3.80 | +0.5% |
| Tunisia | 82 | 3.62 | -0.2% |
Source: WEF, TTDI 2026, p 24, Figure 7. ENCC selected these economies for analysis. Changes use the recalculated 2024 baseline; world ranks are out of 110.
The selected economies provide different reference points for connectivity, destination development and tourism services. They are an analytical selection for this reading, rather than a newly approved official peer group. Their world ranks and scores are reported directly in the same 2026 table, making the numerical comparison internally consistent.
The table shows why score levels and recent change need separate attention. An economy can improve rapidly from a lower starting point, while a higher-scoring destination can retain a strong position with a smaller percentage gain. Egypt can learn from both patterns. The practical task is to identify a relevant service, investment or delivery mechanism, establish whether the institutional conditions are comparable, and test the proposal against Egyptian evidence before treating another destination's experience as a ready-made solution.
11. The pillar reference points
| Pillar | Global | MENA | North Africa |
|---|---|---|---|
| Business Environment | 4.4 | 4.55 | 3.59 |
| Safety and Security | 5.7 | 6.09 | 5.87 |
| Health and Hygiene | 4.8 | 4.73 | 4.18 |
| Human Resources and Labour Market | 4.3 | 4.04 | 3.35 |
| ICT Readiness | 5.2 | 5.33 | 4.47 |
| Prioritization of T&T | 4.5 | 4.47 | 4.82 |
| Openness to T&T | 4.1 | 3.94 | 3.55 |
| Price Competitiveness | 4.5 | 4.81 | 5.60 |
| Air Transport Infrastructure | 4.1 | 4.62 | 3.83 |
| Ground and Port Infrastructure | 3.7 | 3.77 | 3.13 |
| Tourist Services and Infrastructure | 3.0 | 2.92 | 2.62 |
| Natural Resources | 3.0 | 2.03 | 2.42 |
| Cultural Resources | 2.5 | 2.25 | 2.76 |
| Non-Leisure Resources | 2.7 | 2.72 | 2.43 |
| Environmental Sustainability | 4.5 | 3.83 | 3.85 |
| T&T Socioeconomic Impact | 4.2 | 3.45 | 3.19 |
| T&T Demand Sustainability | 3.9 | 4.14 | 3.85 |
Source: WEF, TTDI 2026, pp 21–22, Figure 6, and p 30, Figure 12. Scores range from 1 to 7. Global means retain one decimal; regional means retain two, as published. These are group means, not Egyptian pillar values.
The table presents global and publisher-defined regional averages, with the precision used in their respective source figures. It is not Egypt's pillar profile. North Africa's comparatively strong Price Competitiveness average and the Middle East's broader infrastructure strengths help frame questions, but they cannot establish the size of any Egyptian advantage or shortfall beyond the country's explicitly reported price leadership.
The framework also cautions against equating assets with outcomes. Cultural and natural resource measures concern the development and promotion of tourism opportunities, not simply the physical existence of heritage or landscapes. Non-Leisure Resources covers reasons for business and other travel. Tourist Services and Infrastructure concerns investment, availability and productivity. Reading these distinctions carefully makes it possible to ask targeted questions about the visitor economy without manufacturing country-level scores.
12. Converting price strength into value
Egypt's reported price leadership can support affordability and market access. It does not establish high revenue per visitor, profitability, service quality or the distribution of benefits. A strategy centred only on lower prices could therefore overlook the economic value generated from each visit and the resources required to sustain the offer.
An ENCC policy reading is to examine price and value together. Better service consistency, usable digital information, reliable access between attractions and accommodation, and differentiated experiences are possible channels for increasing value. These are proposed mechanisms for investigation, not findings that the index has measured a particular Egyptian failure. Each requires national evidence on costs, visitor experience, business productivity and local benefits. The case for intervention should then rest on the identified constraint and a feasible response, rather than the assumption that raising a pillar score automatically delivers a specified economic return.
13. Services, skills and delivery capacity
The index's structure links transport, tourist services, labour and digital readiness. A visitor experiences these conditions as a connected journey: obtaining information, booking, reaching a destination, moving locally and receiving services. Improvement in one link may have limited effect if another becomes a bottleneck. This is an analytical interpretation of the framework, rather than a causal result estimated for Egypt by the report.
A useful diagnosis would connect enterprise and workforce information with actual visitor experience. Questions include whether skills match the service offer, whether smaller suppliers can participate, and whether digital systems reduce practical friction. Proposed measures could track service reliability, training outcomes and the participation of local businesses. They should be chosen with the responsible institutions and industry, with clear definitions and a feasible collection burden. Employment volume alone would not answer questions about job quality, productivity or the resilience of the workforce.
14. Resilience and demand management
The report's special focus emphasizes diversified demand, access and operating continuity, value, community benefits and workforce capacity. Its wider discussion highlights climate, economic and geopolitical risks. These themes matter to competitiveness because a destination's ability to continue operating and adapt can influence the durability of its tourism offer.
For Egypt, a proposed resilience review could examine concentration across markets and seasons, the continuity of access and services, and pressure on local infrastructure and natural assets. Diversification should be assessed against costs and delivery capacity, rather than treated as an automatic gain. Similarly, demand management is not simply a call for more visitors. It involves the timing and distribution of activity, the quality of the experience and the effects on communities. The TTDI result supports asking these questions; it does not provide a full Egyptian risk assessment or approve a new national programme.
15. Keep the comparison vintages separate
The 2026 edition recalculates 2019, 2021 and 2024 results using revised data and adjustments. Coverage falls from 119 economies in the original 2024 edition to 110 in 2026, with nine exclusions and no additions. The originally published 2024 result of 3.96 and rank 61 remains a record of that earlier edition. It should not be overwritten by a recalculated vintage.
In particular, dividing the new score of 3.97 by the original 3.96 does not reproduce the publisher's 2.1% change. Reversing a rounded percentage to manufacture an allegedly exact historical score would also be inappropriate. Changes should be quoted from the recalculated series and labelled by vintage and reference interval. The same discipline applies when comparing ranks, regional means and pillar values. Preserving both the original record and the new comparison basis supports continuity without implying that the two publications are methodologically identical.
16. Proposed priorities for an evidence-based response
| Proposed priority | Proposed participants | Indicative horizon | Proposed evidence and monitoring |
|---|---|---|---|
| Complete the diagnosis | Tourism data institutions and researchers; proposed coordination | 0–6 months | Official Egyptian profile; documented definitions, periods and pillar/indicator values |
| Price, value and service quality | Tourism institutions, service providers and private businesses; proposed participation | 6–18 months after diagnosis | Visitor experience, service consistency and enterprise productivity measures chosen using national evidence |
| Connectivity, skills and digital services | Transport, service and training owners; proposed coordination | 6–24 months, subject to resources | Journey reliability; training outcomes; use of digital information and services |
| Demand resilience and local benefits | Destination partners, industry and relevant institutions; proposed coordination | 6–24 months, subject to evidence | Market/season concentration; service continuity; local supplier participation and pressure on assets |
Source: ENCC analysis of the framework and results. Horizons are proposals, not adopted deadlines. Interventions require approval, resources, a baseline and suitable measurement.
These priorities are proposals for review. They are not an approved ENCC programme, an assignment to a ministry, a funding commitment or a claim of implementation. Their sequence should depend on the actual constraint, the availability of evidence and the capacity of the institutions involved. A limited set of well-defined measures is preferable to a long list of indicators without an owner or a practical collection method.
The first diagnostic task is to obtain and verify Egypt's detailed official profile and connect it to national evidence. This would allow confirmed strengths and constraints to be distinguished from plausible questions suggested by the regional picture. Subsequent proposals can then specify the intended beneficiary, the mechanism of improvement, the resources needed and the evidence that would justify continuation or revision.
17. Monitoring progress without targeting a rank alone
A monitoring framework should retain the source edition, the original and recalculated vintages, the indicator period and the direction of improvement. It should also connect tourism outcomes with the enabling conditions that can reasonably influence them. A higher rank is useful context, but it is not a substitute for evidence about service delivery, productivity, local benefits or environmental pressure.
For this reading, the appropriate next analytical step is a verified Egyptian pillar and indicator profile, followed by a small set of comparisons selected for a stated purpose. National and industry information can then help assess whether a proposed action is working between international editions. Such monitoring would supplement the TTDI, rather than alter the publisher's values or attribute a short-term change to the index itself.
18. Scope and sources
This ENCC reading uses the World Economic Forum's Travel & Tourism Development Index 2026. The principal references are the executive summary on page 4, framework and methodology on pages 6–8, pillar performance in Figure 6 on pages 21–22, overall results in Figure 7 on page 24, regional results in Figure 11 on page 29, pillar group averages in Figure 12 on page 30, and the regional classifications on page 67. Page numbers refer to the report's PDF pages.
Publisher figures, ENCC's labelled arithmetic comparisons and proposed policy implications have different roles. The report provides a verified reading of the available results; it does not reproduce all underlying data, independently recalculate the index or supply causal estimates for Egyptian policies. Missing country-level pillar values remain a declared evidence limit.
World Economic Forum — Travel & Tourism Development Index 2026