Observatory / International Indicators > I34 — Travel & Tourism Development Index (TTDI)

ENCC • I34 • TTDI

Egypt Travel & Tourism Competitiveness Observatory

ENCC’s reading of the Travel & Tourism Development Index: what do tourism development conditions reveal about Egypt’s position, and what requires deeper examination? This dashboard brings together Egypt’s result, available benchmarks and the full published readings, while keeping editions and their limits distinct.

Latest reading

Source edition: 2026 • Published: 25 September 2026 • Latest verified published reading

Egypt: turning price competitiveness into sustainable tourism value —2026 reading

Index and methodology

The World Economic Forum publishes the index, in collaboration with Zurich Insurance Group for the 2026 edition. It measures the factors and policies enabling sustainable and resilient travel and tourism development, rather than ranking economies directly by arrivals or revenue. It covers 110 economies,5 organizational dimensions,17 pillars and 102 indicators. Values are normalized to a 1–7 scale; the five dimensions organize presentation and are not used to calculate the overall score. Results use the latest data available at collection in May 2026, with some older inputs. The edition label does not mean every indicator measures the same year.

Egypt’s 2026 result

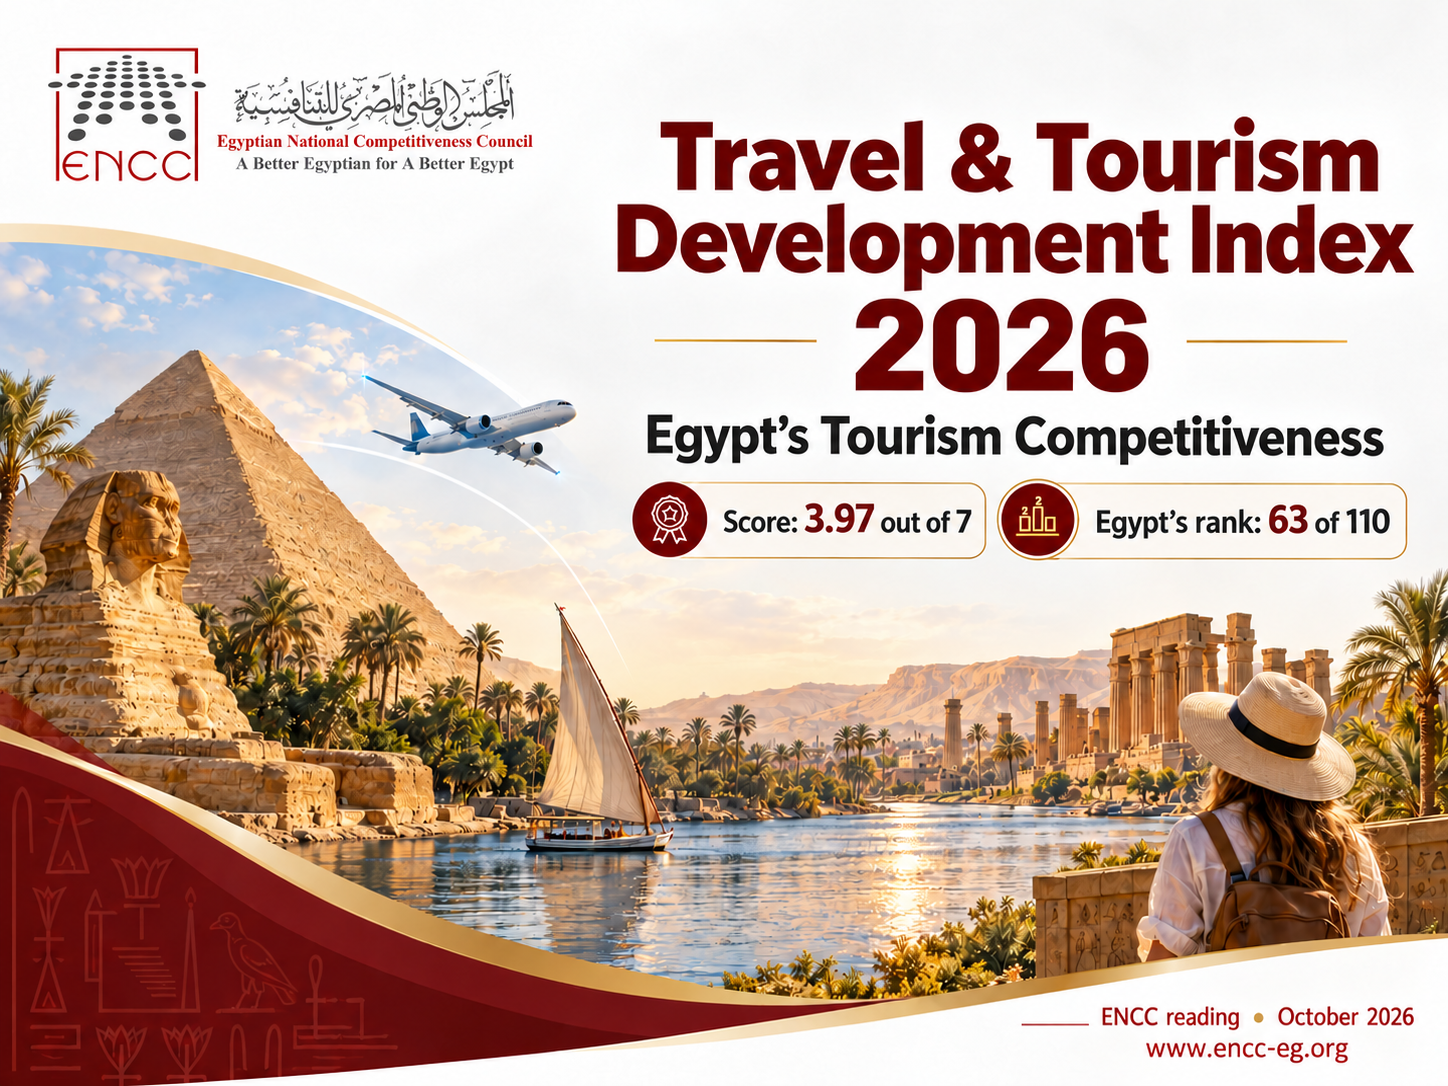
Overall score3.97 / 7Higher is better;2026 edition
World rank63 / 110Rank within the edition’s economies
Price competitivenessTop-rankedPublisher label; not a numerical pillar score
Score change since 2024+2.1%2024 baseline recalculated in 2026
Rank change since 2024−2Down 2 places; recalculated baseline
Change since 2019+7.1% / +7Score / places;2019 recalculated in 2026

A score can rise while rank falls when other economies also move. Neither measure alone estimates the effect of a particular Egyptian policy.

Comparisons and visual readings

Egypt and regional benchmarks —2026

Egypt3.97 / 7 — Economy
Middle East and North Africa3.98 / 7 — Group mean
North Africa3.74 / 7 — Group mean

Scale 1–7; marker positions use the same range. Egypt belongs to both groups; means are not independent controls or substitutes for Egyptian pillar scores. Source: pp 24,29–30.

Selected regional economies —2026

United Arab Emirates4.56 / 7 — Rank 22 of 110
Saudi Arabia4.45 / 7 — Rank 29 of 110
Qatar4.23 / 7 — Rank 47 of 110
Oman3.98 / 7 — Rank 62 of 110
Egypt3.97 / 7 — Rank 63 of 110
Morocco3.84 / 7 — Rank 70 of 110
Jordan3.80 / 7 — Rank 73 of 110
Tunisia3.62 / 7 — Rank 82 of 110

ENCC analytical selection, not an official peer group. Scores are out of 7 and world ranks out of 110. Higher scores and lower ranks are better. Source: p 24,Figure 7.

Egypt’s publisher-reported score changes

Since recalculated 2024+2.1%
Since recalculated 2019+7.1%

Relative changes, not percentage points. Both comparisons use the 2026 vintage, but their intervals differ; they are not annual growth rates. Rounded percentages are not reversed into invented baseline scores. Source: p 24.

Selected global pillar shifts

Cultural Resources+9.6%
Tourist Services and Infrastructure+9.2%
Air Transport Infrastructure+7.2%
T&T Demand Sustainability+2.3%
Price Competitiveness-3.1%
T&T Socioeconomic Impact-3.5%

Global average changes against 2024 recalculated in 2026, not Egyptian pillar changes. Demand sustainability improved 2.3% despite continuing concentration and seasonality challenges. Source: pp 21–22,Figure 6.

Pillar average details

Show the 17 pillars and comparison limits
Published 2026 scores from 1 to 7; these are averages, not Egyptian values
PillarGlobalMENANorth Africa
Business Environment4.44.553.59
Safety and Security5.76.095.87
Health and Hygiene4.84.734.18
Human Resources and Labour Market4.34.043.35
ICT Readiness5.25.334.47
Prioritization of T&T4.54.474.82
Openness to T&T4.13.943.55
Price Competitiveness4.54.815.60
Air Transport Infrastructure4.14.623.83
Ground and Port Infrastructure3.73.773.13
Tourist Services and Infrastructure3.02.922.62
Natural Resources3.02.032.42
Cultural Resources2.52.252.76
Non-Leisure Resources2.72.722.43
Environmental Sustainability4.53.833.85
T&T Socioeconomic Impact4.23.453.19
T&T Demand Sustainability3.94.143.85

Published precision is retained: one decimal for global means and two for regional means. Source: pp 21–22,30. The examined report does not supply Egypt’s full numerical 17-pillar vector; group means do not fill that gap.

Analytical takeaways

  • Price competitiveness is a specific strength, not a claim of leadership across all pillars or evidence of higher spending or revenue per visitor.
  • Egypt’s overall score is close to the MENA average, but that mean does not identify Egyptian service, transport or skills constraints. A proposed diagnostic priority is a verified official country profile linked to national evidence.
  • Turning affordability into value calls for examining service consistency, connectivity, skills, digital readiness, resilience and local benefits. These are ENCC analytical implications and proposals for review, not an adopted programme, assignment or funding commitment.

Original editions remain separate

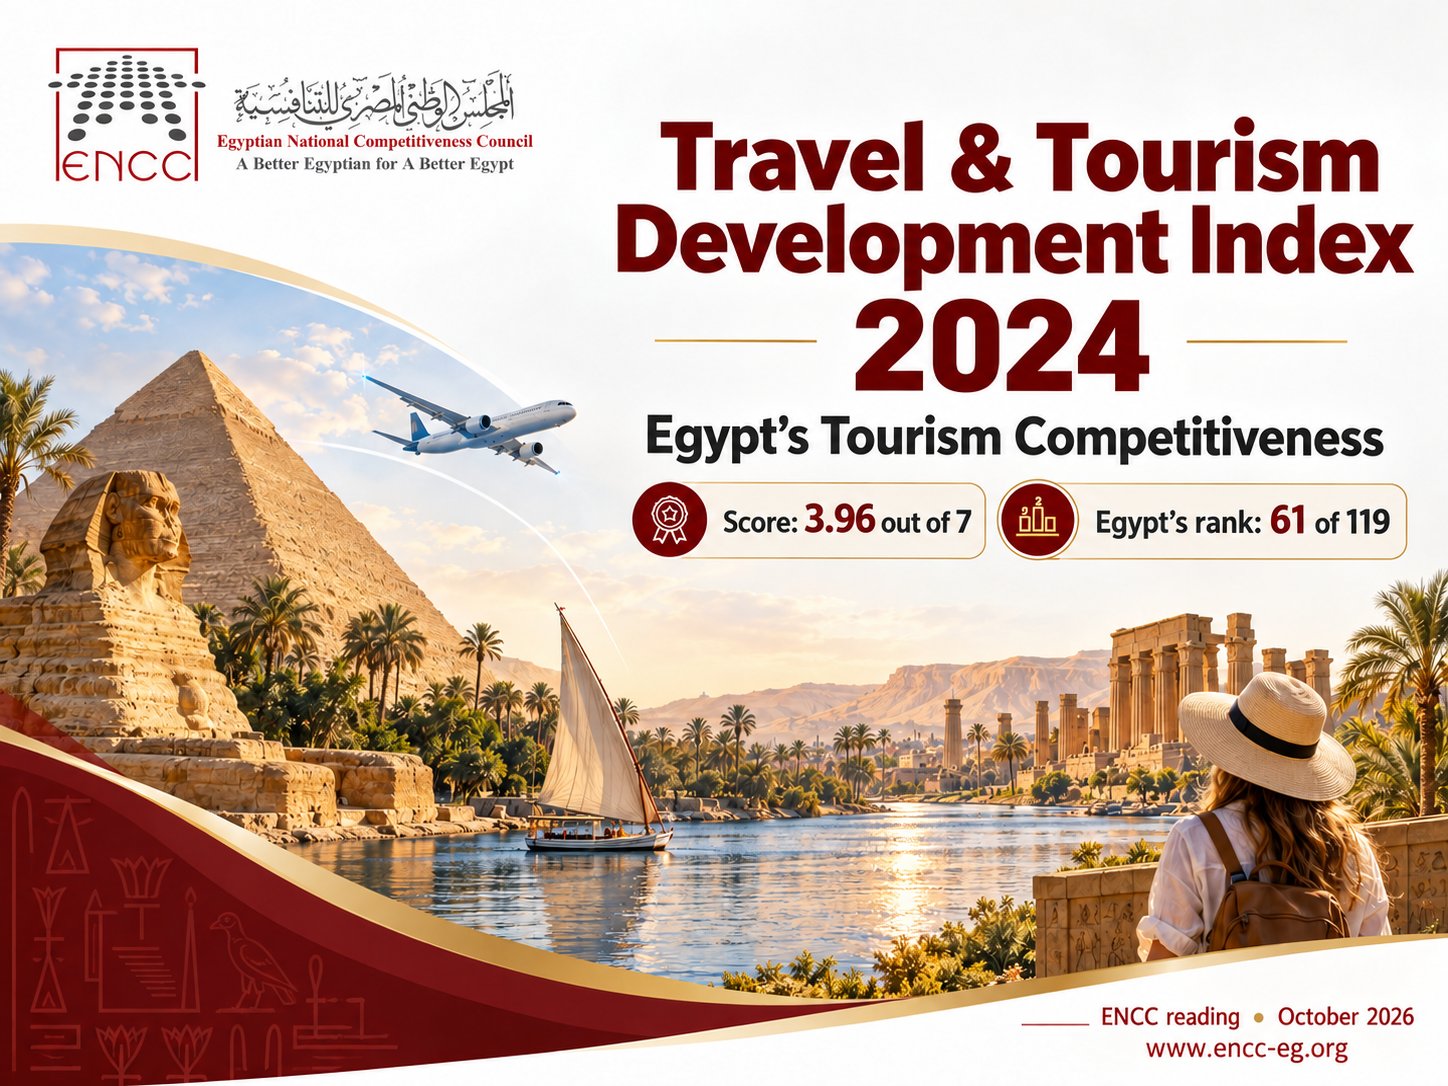
Original 2024 publication record: rank 61 of 119 economies and score 3.96 out of 7. This is a separate archive record, not the recalculated baseline used in the 2026 percentages above. Coverage, methodology and data differ; no direct growth is calculated from 3.97/3.96 or rank trend drawn from 61 to 63.

Read the preserved 2024 edition

Read the current 2026 edition

This dashboard is a content snapshot dated 31 October 2026 and requires review when a new edition is released. It does not claim automatic database synchronization or a recurring update service. Figures come from the World Economic Forum’s 2026 report; the original 2024 comparison remains linked separately. Publication, data collection and ENCC reading dates have distinct roles. The full articles provide methodology, evidence and comparison limits.

Source: World Economic Forum — TTDI 2026

Article archive

The existing published readings in this category follow below with their original links and images.