

Egypt in TTDI 2024: Turning Tourism Strengths into Better Services and Wider Economic Benefits
ENCC Observatory
Travel & Tourism Development Index — 2024 edition
Egypt in TTDI 2024: Turning Tourism Strengths into Better Services and Wider Economic Benefits
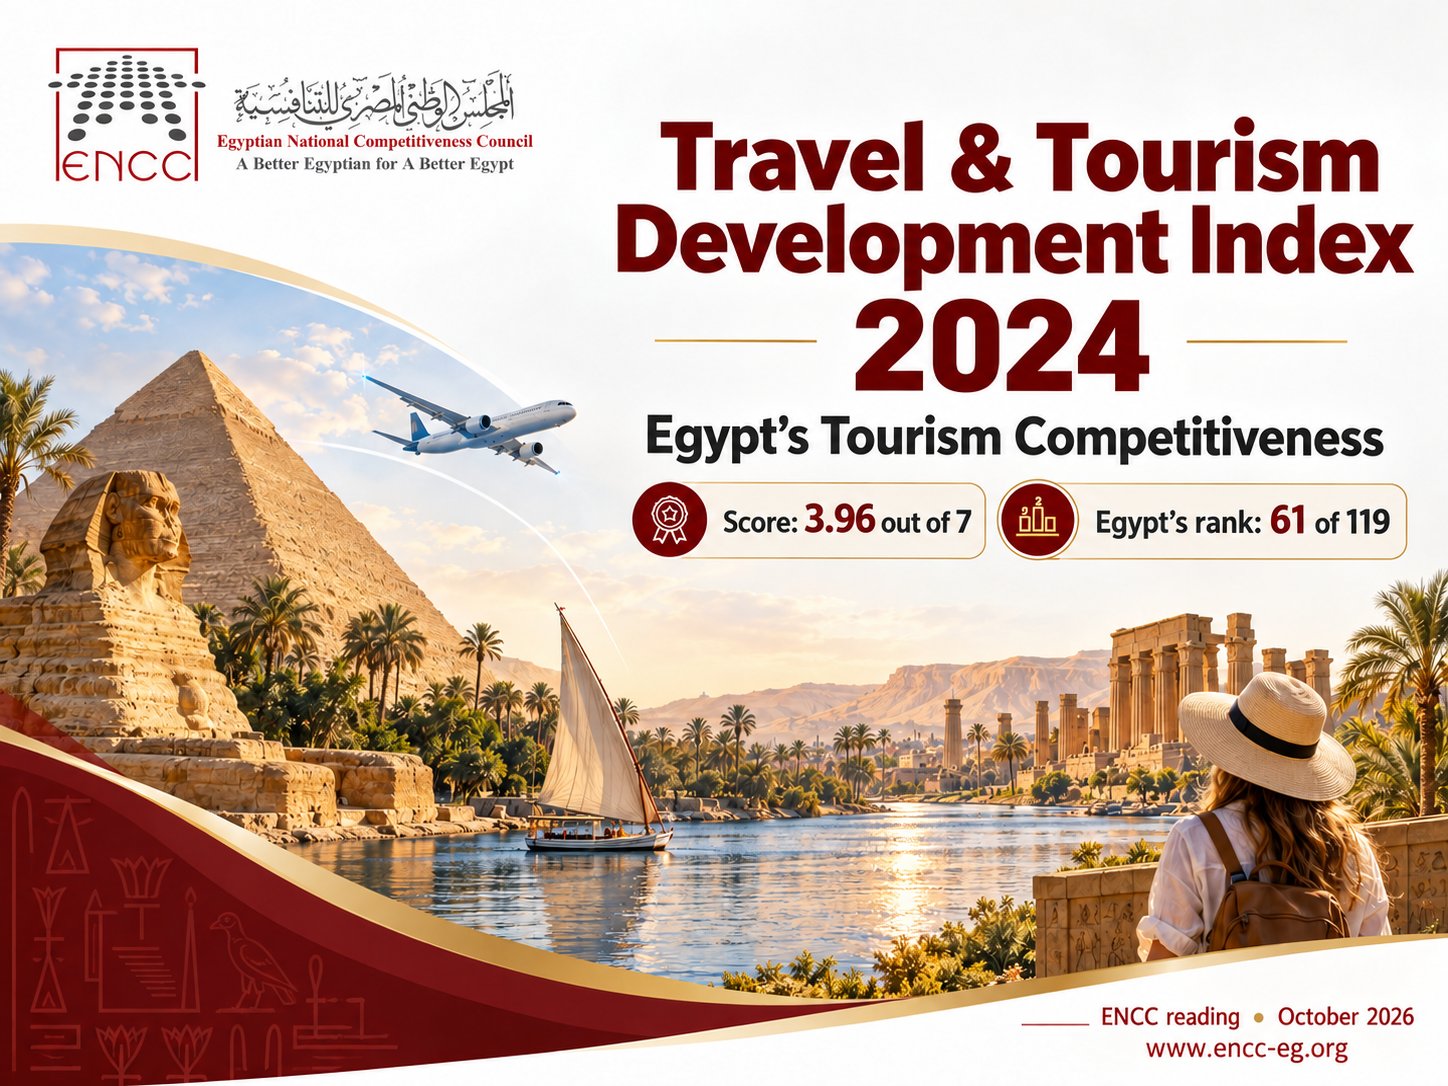
Egypt ranks 61st of 119 economies with 3.96 points in TTDI 2024. This ENCC analytical reading examines all 17 pillars, regional benchmarks and the publisher’s recalculated historical comparison, and proposes an evidence-based agenda for visitor services, skills and wider benefits. Proposals are for review.
1. Executive competitiveness reading
Egypt’s 2024 Travel & Tourism Development Index result points to a strategic opportunity alongside a clear delivery challenge. The World Economic Forum places Egypt 61st among 119 economies, with a score of 3.96 on a scale from 1 to 7. In the publisher’s recalculated comparison with 2019, Egypt improves by five places and its score rises by 4.3%. These are encouraging historical results, but they do not establish that every part of the tourism economy improved or that a particular policy caused the movement.
The component profile matters more for action than the headline alone. Egypt combines comparatively strong price competitiveness and prioritization of tourism with lower scores for tourist services, non-leisure resources, and tourism’s socioeconomic impact. Its cultural and natural resource scores exceed the published regional averages, yet resources need supporting services, skills, access and destination management to become durable value for visitors and host communities. ENCC’s analytical reading is therefore to connect attraction, visitor experience and local economic benefit, while treating the proposals below as matters for discussion rather than an adopted government programme.
2. What the index measures and why it matters
The TTDI examines factors and policies that support sustainable and resilient tourism development. It is not a league table of visitor numbers, tourism receipts or the quality of every individual holiday experience. A destination can attract many visitors while facing weaknesses in skills, environmental management or the distribution of economic benefits. Conversely, a stronger enabling environment may take time to translate into sector outcomes. The index helps organize those questions; it does not replace direct evidence about the sector.
The 2024 edition, produced with the University of Surrey, belongs to the TTDI framework that evolved from the earlier Travel & Tourism Competitiveness Index. Its value for Egypt is as a structured diagnostic and a common basis for dialogue among tourism businesses, transport operators, public authorities and local communities. Decisions should connect the diagnostic to observed operational problems, investment choices and measurable outcomes, rather than make improvement in the composite score the sole objective.
3. Edition, coverage and data reference
This is a reading of the 2024 publication, released on 21 May 2024. It preserves the original edition’s results even though the analysis is being completed later. The index covers 119 economies and uses the latest information available when collection closed at the end of 2023. Individual indicators may refer to earlier periods. The label “2024” therefore identifies the edition and does not mean that every input measures the whole calendar year 2024.
The framework contains five presentation dimensions, 17 pillars and 102 indicators. This review examines all of Egypt’s published pillar scores, the official overall ranking table, and the regional benchmarks available in the report. It does not claim to have reconstructed the complete underlying 102-indicator database. Preserving that boundary allows the available evidence to be used fully without assigning unsupported precision to the diagnosis.
4. Methodology and historical comparability
The overall score is the arithmetic mean of the 17 pillar scores. The five dimensions organize presentation and categorization; they are not five equally weighted blocks in the overall calculation. Indicator values are placed on a common 1-to-7 scale, with higher scores representing better outcomes under the publisher’s definitions. Several pillars use subpillars, and quantitative statistics are combined with Executive Opinion Survey evidence. These choices must remain visible when interpreting differences between countries.
The 2024 methodology changed the previous framework and reduced the indicator count from 112 to 102. The publisher accordingly provides recalculated 2019 and 2021 results. Historical comparisons in this article use that 2024 vintage. Egypt’s five-place improvement and 4.3% score increase are publisher-reported comparisons with recalculated 2019, not comparisons against an older headline copied from a previous publication. The percentage is a relative score change, not a change of 4.3 index points or percentage points. A later edition’s recalculations must likewise remain separate from the original 2024 record.
5. Global context: recovery does not remove constraints
The report was written during the recovery from the pandemic. It expected international arrivals to return to pre-pandemic levels in 2024, while warning that recovery was uneven across markets and segments. That was the outlook at publication, not a newly verified statement about present conditions. Its wider message remains useful for understanding the edition: returning demand can coexist with shortages of labour, air capacity, accommodation investment and other services.
Seventy-one of the 119 economies improved their scores relative to recalculated 2019, but the average score was only 0.7% higher. The United States led the table, followed by Spain and Japan. Leading economies generally combined enabling conditions, transport and visitor services with developed attractions. Developing economies also recorded progress, including Egypt, but the report emphasized the investment and institutional gaps separating tourism potential from reliable delivery. For competitiveness policy, the lesson is to examine the whole visitor journey and the operating environment around it.
6. The regional picture and Egypt’s position
The Middle East and North Africa group includes 14 covered economies and shows substantial internal variation. The United Arab Emirates ranks 18th globally, Saudi Arabia 41st, Qatar 53rd, and Egypt 61st. These examples provide regional context; they are not an approved peer group or evidence that countries have identical markets, resources or development models. The report identifies Egypt as the highest-scoring covered economy in North Africa.
Regional aviation hubs and investment programmes coexist with weaknesses in workforce inclusion and the distribution of tourism benefits. The report also identifies conflict as an external risk to future tourism development. Egypt’s practical use of the regional comparison is to distinguish the areas in which its own scores are stronger from those where operational investigation is warranted. Regional averages are descriptive benchmarks, not targets that automatically establish the appropriate level of spending or the right reform for a particular Egyptian destination.
7. Egypt’s headline result and the limits of rank
Egypt’s score of 3.96 places it close to the global average; the publisher reports a difference of minus 0.2% from that average. The rank is 61 out of 119, and the recalculated 2019 comparison shows a move from 66th to 61st. Score movement and rank movement answer different questions: the first concerns Egypt’s measured performance, while the second also depends on other economies and the comparison population.
Several economies display the same rounded score of 3.96 in the ranking table. It would therefore be misleading to rebuild the ranking from rounded figures, interpret a small displayed difference as a large structural gap, or reconstruct an exact earlier score from the rounded percentage change. The sound conclusion is that Egypt improved on the publisher’s consistent historical basis while retaining a varied component profile that the overall position alone cannot explain.
8. Enabling environment: follow the visitor and the enterprise
Within the enabling environment, Egypt scores 3.88 for business conditions, 5.37 for safety and security, 3.95 for health and hygiene, 3.43 for human resources and the labour market, and 4.45 for ICT readiness. All five scores are below their respective MENA means in the published table. This comparison identifies a set of questions for investigation, not proof that every enterprise or destination faces the same constraint.
The practical focus should be on how general conditions affect tourism delivery: predictable procedures for businesses, access to an appropriately skilled workforce, reliable digital services and health and safety arrangements along the visitor journey. Labour-market analysis should consider retention, working conditions and access to opportunities as well as training. Digital readiness should be connected to booking, payment, information and service coordination. The index does not provide the local operational evidence needed to choose between individual interventions, so the next diagnostic step is to gather that evidence from businesses and destinations.
9. Tourism policies, openness and price competitiveness
Egypt’s score is 5.87 for prioritization of tourism, 3.09 for openness to tourism, and 6.11 for price competitiveness. The corresponding MENA means are 4.51, 3.63 and 4.62. This is a distinctive combination: tourism receives relatively strong priority under the index’s measures and the destination is price competitive, while the openness pillar is below the regional benchmark. The pillars describe different mechanisms and should not be compressed into a single claim that all tourism policy is either strong or weak.
Price advantage can help attract demand, but lasting competitiveness also depends on value, reliability and service quality. It should not be read as evidence that margins, wages or investment capacity are adequate. For openness, the pillar includes travel facilitation and related measures; it is not a recommendation to change a particular visa or aviation rule without examining its full implications. A useful policy review would trace friction from trip planning to arrival and onward movement, using the responsible authorities’ current evidence.
10. Infrastructure and services: connect access to experience
Egypt records 4.58 for air transport infrastructure and 3.85 for ground and port infrastructure, both above the MENA averages of 4.13 and 3.56. Tourist services and infrastructure, however, score 2.76 against a regional mean of 3.18. The pattern suggests that the analytical agenda should distinguish reaching the destination from the capacity and productivity of services experienced after arrival.
The service pillar incorporates accommodation-related measures, productivity and investment intensity; it is not a direct satisfaction score for every hotel. The first task is to identify which underlying indicators and locations account for the result. A destination-level review can then examine transport connections, service coordination, maintenance, accessibility and business constraints. New infrastructure proposals should be tested against evidence of bottlenecks and visitor flows, with attention to use and operating quality as well as physical capacity. The table alone cannot establish which project should receive financing.
11. Natural, cultural and non-leisure resources
Egypt’s natural resources score is 3.11, cultural resources 3.18, and non-leisure resources 2.39. The first two exceed the MENA means of 2.08 and 2.19; non-leisure resources are below the regional mean of 2.62. These measures capture development, recognition and demand for resources as well as aspects of their presence. They should not be interpreted as a valuation of Egypt’s heritage or as an exhaustive inventory of its attractions.
The competitiveness question is how to connect resources to coherent experiences and local value. Possible areas for examination include site information, access, interpretation, links between attractions and services, destination promotion and the participation of local suppliers. Non-leisure travel also warrants a separate market diagnosis rather than an assumption that leisure strengths automatically translate into business, educational or other travel demand. Such work can identify opportunities for diversification while retaining the protection and management requirements of natural and cultural assets.
12. Sustainability and the distribution of benefits
Egypt scores 4.07 for environmental sustainability, 2.27 for tourism’s socioeconomic impact, and 4.90 for demand sustainability. Against MENA means of 3.86, 3.75 and 3.80, the socioeconomic result is the clearest relative weakness among these three pillars. The environmental and demand scores are comparatively stronger, but neither demonstrates that every destination is free of ecological pressure, congestion or seasonal vulnerability.
The socioeconomic pillar covers measures such as economic and employment multipliers, high-wage jobs and labour gender parity. Its score is not the percentage contribution of tourism to GDP and does not by itself identify the cause of a weak result. The appropriate response is to examine the underlying measures and the links between tourism businesses, workers and local supply chains. Demand sustainability also calls for local evidence on seasonality, visitor concentration and length of stay. Growth should be assessed together with the quality and distribution of its benefits.
13. A complete pillar profile for the Egyptian diagnosis
The table brings the 17 published Egyptian scores together with the report’s MENA benchmarks. The final column is ENCC arithmetic using the displayed rounded values: Egypt minus the regional mean, expressed in index points. It is a same-edition cross-sectional comparison, not a historical change or a causal estimate. Positive and negative differences show where the diagnostic questions differ across pillars.
| Pillar | Egypt | MENA mean | Egypt minus MENA |
|---|---|---|---|
| Business Environment | 3.88 | 4.26 | -0.38 |
| Safety and Security | 5.37 | 5.86 | -0.49 |
| Health and Hygiene | 3.95 | 4.55 | -0.60 |
| Human Resources and Labour Market | 3.43 | 3.83 | -0.40 |
| ICT Readiness | 4.45 | 5.17 | -0.72 |
| Prioritization of T&T | 5.87 | 4.51 | +1.36 |
| Openness to T&T | 3.09 | 3.63 | -0.54 |
| Price Competitiveness | 6.11 | 4.62 | +1.49 |
| Air Transport Infrastructure | 4.58 | 4.13 | +0.45 |
| Ground and Port Infrastructure | 3.85 | 3.56 | +0.29 |
| Tourist Services and Infrastructure | 2.76 | 3.18 | -0.42 |
| Natural Resources | 3.11 | 2.08 | +1.03 |
| Cultural Resources | 3.18 | 2.19 | +0.99 |
| Non-Leisure Resources | 2.39 | 2.62 | -0.23 |
| Environmental Sustainability | 4.07 | 3.86 | +0.21 |
| T&T Socioeconomic Impact | 2.27 | 3.75 | -1.48 |
| T&T Demand Sustainability | 4.90 | 3.80 | +1.10 |
The strongest positive differences include price competitiveness, prioritization of tourism, demand sustainability and natural and cultural resources. The largest negative difference is socioeconomic impact. These comparisons support prioritization of further investigation, while the underlying indicators and destination-level evidence are needed before selecting an intervention. No separate dimension aggregate has been invented for this article.
14. An integrated competitiveness agenda
The profile supports an agenda built around conversion: converting accessibility and attractive resources into a better visitor experience, and converting tourism activity into stronger local economic and social benefits. This is an analytical proposal, not an adopted ENCC policy or proof that any single measure will improve the index. It also means that a low score should trigger a question about the underlying mechanism rather than an automatic spending commitment.
Three connections deserve particular attention. First, resource development needs visitor services, skills and digital information. Second, price competitiveness needs productivity and a business model capable of sustaining quality and investment. Third, growth in tourism activity needs links to local suppliers and better employment outcomes. These connections can provide a practical structure for dialogue between the public and private sectors, with the Observatory maintaining a shared evidence base and identifying where the data do not yet permit a conclusion.
15. A proposed sequence for action
The following sequence is offered for review. Its time windows run from any subsequent programme approval, not from the 2024 publication date. Suggested responsible parties identify types of stakeholders to involve; they do not assign mandates or announce an agreed budget.
| Window | Proposed work | Suggested participants | Evidence of completion |
|---|---|---|---|
| 0–6 months | Validate underlying weak-pillar indicators and select destination-level diagnostic questions | Tourism and statistics authorities, businesses, researchers | Documented baseline, data definitions and agreed questions |
| 0–6 months | Map visitor-service bottlenecks and local supplier links | Destination managers, transport and tourism operators, local businesses | Evidence-backed bottleneck and supplier map |
| 6–12 months | Pilot improvements in service coordination, skills or digital information | Relevant authorities, employers and training providers | Before-and-after service and workforce measures |
| 6–12 months | Develop investable responses to verified bottlenecks | Public and private project owners | Options appraisal including operating and maintenance requirements |
| 12–24 months | Expand only the interventions supported by pilot evidence | Responsible implementing bodies and participating firms | Outcome review, costs and reasons for expansion or redesign |
The Observatory’s role would be to organize evidence and monitor the agreed measures, rather than substitute for the mandates of implementing bodies. Baselines, targets, funding and ownership would need to be settled by those bodies before the proposals become an operational programme.
16. Monitoring outcomes and managing risk
Monitoring should include a small, balanced set of measures drawn from the actual interventions: visitor-service reliability, selected journey times, workforce retention or skills outcomes, participation of local suppliers, and locally relevant sustainability pressures. These are proposed monitoring areas, not indicators already measured or targets adopted by the Council. Definitions, collection methods and responsible data owners should be explicit so that improvements are not claimed from incompatible series.
Risks include external demand shocks, regional security developments, cost pressures, environmental stress and constraints on implementation capacity. The response should be a documented set of assumptions and trigger points, with periodic reassessment of whether the chosen intervention remains relevant. A higher future index score would be one piece of evidence, but success should also be visible in services, enterprises, workers and communities. Equally, a change in methodology or country coverage must not be mistaken for an operational gain or loss.
17. Evidence limits and statements that are not supported
The available evidence supports the original overall result, the full published Egyptian pillar profile, regional benchmark comparisons and the publisher’s recalculated historical changes. It does not establish present-day Egyptian tourism outcomes, the detailed contribution of every underlying indicator, an independently verified effect of a particular reform, or an approved peer group and programme budget. Publication-year labels, collection cut-offs and individual data periods remain distinct.
The report combines statistics, survey evidence and, where necessary, estimated inputs under its methodology. The imputation appendix was examined as part of this reading; the absence of a country name in a listed imputation row is not a general guarantee that every underlying input is current or equally precise. The analysis therefore retains the published figures, labels local arithmetic separately and identifies the further data needed. Recommendations remain proposals until the relevant review and approval are recorded.
18. Sources and conclusion
The principal source is the World Economic Forum’s Travel & Tourism Development Index 2024, produced in collaboration with the University of Surrey. The overall ranking and Egypt’s headline figures appear on page 11; the MENA pillar table is on page 39 and the regional interpretation continues on page 40. Framework and data-reference explanations appear on pages 7–10, with calculation and comparability details on pages 53–65. Indicator definitions and sources are set out in the report’s appendices.
Egypt’s 2024 result offers a basis for a practical conversation about tourism competitiveness. It identifies assets and enabling strengths alongside service, skills and socioeconomic questions that deserve closer investigation. The useful next step is to connect each priority to evidence, a responsible party and a measurable outcome. In that way, the index becomes a starting point for coordinated improvement while its methodological and historical limits remain clear.