
Corruption Perceptions Index 2024 (CPI 2024): Global performance review ▸ Expanded reading of Egypt’

Corruption Perceptions Index 2024 (CPI 2024)
Corruption Perceptions Index 2024 (CPI 2024): Global performance review ▸ Expanded reading of Egypt’s position ▸ A reform roadmap (6–24 months)
Corruption Perceptions Index 2024 (CPI 2024): Global performance review… Where does Egypt stand, and a reform roadmap
A professional English newsroom-style reading of CPI 2024: key facts ▸ methodology ▸ global & regional signals ▸ Egypt’s position ▸ priority gaps ▸ a practical reform roadmap (6–24 months) with measurable KPIs.
Lead (1–2 lines):
Key facts about CPI 2024 ▸ how scores/ranks are produced and what the index does/does not measure ▸ global signals (average at 43, persistent plateau) ▸ regional lens (MENA at 39/100) ▸ Egypt’s CPI path across 2020–2024 and a focused comparison with (Saudi Arabia / Türkiye / UAE / Morocco / Jordan) ▸ priority gaps ▸ a 6–24 month action roadmap ▸ measurable monitoring KPIs.
(1) General introduction
The Corruption Perceptions Index (CPI) is among the most cited global governance benchmarks because it condenses a complex integrity environment into a comparable signal across 180 countries and territories, based on how experts and businesspeople perceive public-sector corruption. It is best read as a high-level risk signal about public decision-making integrity, the credibility of enforcement, and the transparency ecosystem—rather than as a direct census of corruption incidents. Since 2012, CPI results are designed to be comparable over time on a 0–100 scale, making the index useful for tracking broad trajectories and for guiding policy attention to “high-risk interfaces” (procurement, conflicts of interest, access to information, and accountability).
CPI 2024 delivers a double message. First, global progress remains limited: the global average is 43, and over two-thirds of countries score below 50/100; while 32 countries have improved significantly since 2012, 148 have stagnated or worsened. Second, the 2024 edition puts a strong thematic emphasis on climate action: corruption is framed as a direct blocker through the misuse of funds, policy capture, and undue influence that weakens environmental outcomes—while also clarifying that CPI itself does not directly measure some related channels (e.g., certain cross-border “dirty money” dynamics).
For Egypt, CPI is most useful when translated into a measurable reform program—without overstating what the index can prove.
(2) Essential Data Card
CPI 2024 is an annual ranked index issued by Transparency International, publishing scores and ranks for 180 countries/territories on a 0–100 scale, supported by official materials (report, results/tables, methodology notes).
Official primary links (canonical):
- Landing (CPI 2024): https://www.transparency.org/en/cpi/2024
- Report PDF: https://images.transparencycdn.org/images/CPI2024_Report_Eng1.pdf
- Results & Trends (XLSX): available within CPI 2024 official materials (via the landing page)
- Methodology explainer (ABCs): https://www.transparency.org/en/news/how-cpi-scores-are-calculated
Mini table (mandatory):
| Item | Value |
|---|---|
| Issuer | Transparency International |
| Official name | Corruption Perceptions Index 2024 (CPI 2024) |
| Edition label / year | 2024 |
| Date (ISO) | 2025-02-11 |
| Coverage | 180 countries/territories; 0–100 scale |
| Official links | Landing / Report PDF / Results&Trends / Methodology |
(3) Methodology and pillars/dimensions
Data sources & construction (what is officially stated):
- Each country score is built from at least 3 sources out of a total of 13 corruption-related surveys/assessments.
- CPI measures perceptions of public-sector corruption among experts and businesspeople.
- Score matters more than rank: rank is a relative position and can shift with broader coverage/score movements across all countries; the score is the core signal on the 0–100 scale.
- Small year-to-year movements are not always statistically meaningful; significance should be checked in the full results tables where statistically significant changes are indicated.
What CPI covers (examples of themes reflected in underlying sources):
Bribery; diversion of public funds; officials using office for private gain without consequences; government capacity to contain corruption; nepotistic appointments; conflict-of-interest and asset disclosure rules; state capture by narrow interests; and access to public information.
What CPI does not cover (examples):
Citizens’ direct lived experiences; certain illicit financial flows/money laundering as direct measurements; private-sector corruption; and some informal-market dynamics—so CPI should be treated as an integrity “environment signal,” not a full map of all corruption forms.
Track_1 rule: CPI is a ranked index, so reporting score/rank is appropriate where officially published.
(4) Global and regional trends
Global section
- Long-run split (since 2012): 32 countries improved significantly while 148 stagnated or worsened.
- Persistent plateau: the global average remains 43, and over two-thirds of countries score below 50/100.
- Climate integrity theme: CPI 2024 frames corruption as undermining climate action through misuse of funds and undue influence/policy capture; while noting that CPI does not directly quantify some related cross-border financial channels.
Expanded regional section (MENA) based on CPI 2024 page extracts
- The CPI 2024 narrative notes that the Middle East & North Africa (MENA) regional average rose slightly to 39/100 (a one-point increase), described as the first rise in more than a decade—while stressing that meaningful progress depends on addressing conflict and authoritarian constraints.
Focused comparison (2020–2024) for: Egypt – Saudi Arabia – Türkiye – UAE – Morocco – Jordan
Cell format = score (rank out of 180).
| Country/Economy | 2020 | 2021 | 2022 | 2023 | 2024 |
|---|---|---|---|---|---|
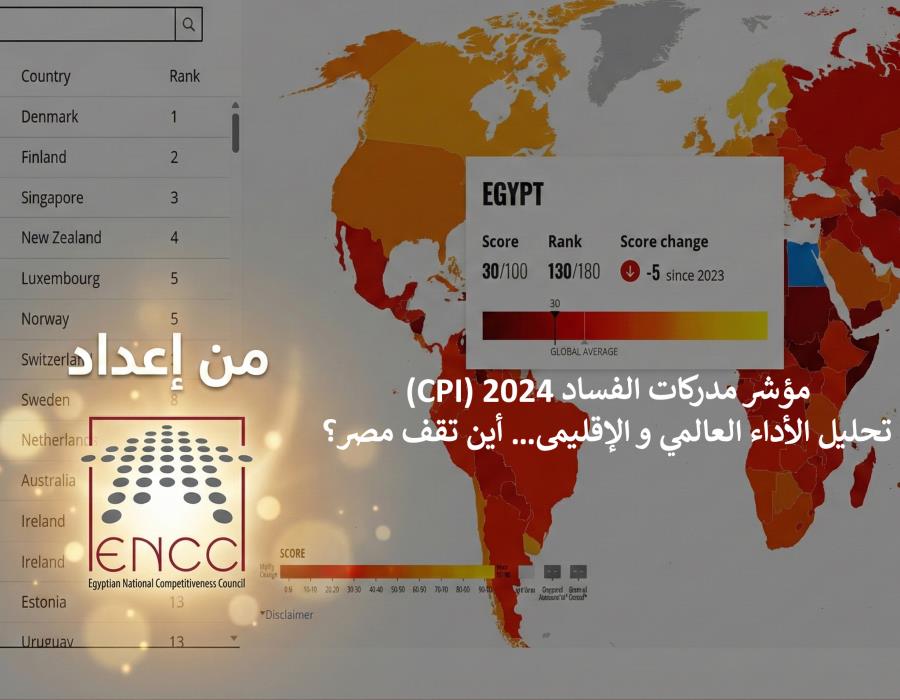
| Egypt | 33 (117) | 33 (117) | 30 (130) | 35 (108) | 30 (130) |
| Saudi Arabia | 53 (52) | 53 (52) | 51 (54) | 52 (53) | 59 (38) |
| Türkiye | 40 (86) | 38 (96) | 36 (101) | 34 (115) | 34 (107) |
| United Arab Emirates | 71 (21) | 69 (24) | 67 (27) | 68 (26) | 68 (23) |
| Morocco | 40 (86) | 39 (87) | 38 (94) | 38 (97) | 37 (99) |
| Jordan | 49 (60) | 49 (58) | 47 (61) | 46 (63) | 49 (59) |
Compact takeaways (within these six only):
- UAE remains the strongest performer in the set across the period (high-60s/low-70s; ranks in the 20s).
- Saudi Arabia shows a notable jump in 2024 compared to 2020–2023 levels.
- Jordan is relatively stable around the high-40s.
- Morocco and Türkiye trend downward gradually across the period.
- Egypt shows volatility: stable (2020–2021), weaker (2022), improved (2023), then back to 30 in 2024—reinforcing the need to focus on the score path and statistical significance markers rather than rank headlines alone.
(5) Egypt performance (Facts) — under Egypt_Data_Available
Egypt_Data_Available = Yes
- In CPI 2024, Egypt scores 30/100, ranks 130/180, and the official country output indicates a -5 change versus the prior year.
- Five-edition tracking (2020–2024):
| Year | Score | Rank |
|---|---|---|
| 2020 | 33 | 117 |
| 2021 | 33 | 117 |
| 2022 | 30 | 130 |
| 2023 | 35 | 108 |
| 2024 | 30 | 130 |
Disciplined reading (no causal claims):
- The key feature is the swing down to 30 (2022), up to 35 (2023), then back to 30 (2024).
- Because CPI is perceptions-based and year-to-year changes may be statistically non-significant, Egypt’s interpretation should prioritize the score trend and check significance flags in the official results tables, rather than treating rank movement as the main story.
(6) Brief tables/lists — Mandatory (short and functional)
Table 1 (mandatory, 6–10 rows): “Main axis ↔ sub-element ↔ Egypt status ↔ short policy note”
> CPI does not publish a standardized per-country “sub-component breakdown,” so Egypt’s sub-elements are marked as “not available” while policy notes remain aligned to the CPI measurement scope.
| Main axis | Sub-element | Egypt status (brief) | Short policy note |
|---|---|---|---|
| CPI measurement scope | Bribery | Not available in the accessible extracts | Strengthen prevention + enforcement and reduce discretionary touchpoints |
| CPI measurement scope | Diversion of public funds | Not available in the accessible extracts | Expand traceability of spending and contracts; publish verifiable data |
| CPI measurement scope | Conflict of interest / asset disclosure | Not available in the accessible extracts | Unified disclosure rules + verification + credible sanctions |
| CPI measurement scope | Whistleblower protection | Not available in the accessible extracts | Safe reporting channels + legal safeguards + follow-up protocols |
| CPI measurement scope | Nepotism in civil service | Not available in the accessible extracts | Merit-based hiring/promotion with published standards |
| CPI measurement scope | Access to information | Not available in the accessible extracts | Proactive publication of procurement/spending and service data |
| CPI result (Track_1) | Score/Rank (2024) | 30/100; 130/180 | Treat score as the anchor; rank is secondary |
Table 2 (optional)
Not applicable / not available within the official inputs used for this write-up (a full “Top 5 list” is not embedded here).
(7) Performance gaps and top improvement priorities (Top 5) — Mandatory
- Procurement & spending transparency gap: limited proactive disclosure raises diversion risk. (Governance/Data)
- Conflict-of-interest & disclosure gap: inconsistent standards weaken deterrence. (Legal/Governance)
- Whistleblower protection gap: weak safe reporting reduces detection. (Legal/Regulatory)
- Accountability & enforcement gap: credibility depends on consistent consequences. (Governance/Executive)
- Access-to-information gap: transparent public information strengthens trust and predictability. (Data/Governance)
(8) Reform roadmap (6–24 months) — Mandatory
| Time horizon | Action | Lead/coordinator type | Measurable KPI | Evidence anchor |
|---|---|---|---|---|
| 0–6 months | Audit procurement/contract/spending disclosure map; publish a release calendar | Government / oversight | Published dataset list + publication schedule (Baseline: not available) | Official Extract |
| 0–6 months | Launch/upgrade a unified safe reporting channel + referral protocol | Oversight / justice | Response time; # of cases processed (Baseline: not available) | PositionPaper |
| 6–12 months | Update and standardize COI + asset disclosure + verification rules | Legislature / government | % of targeted officials covered; annual verification rate | Governance |
| 6–12 months | Publish periodic enforcement transparency stats (privacy-safe) | Justice | Quarterly publication issued consistently | Official Extract |
| 12–18 months | Expand proactive publication of public service requirements/fees/processing times | Government services | % of priority services with updated public guides | TrackAnalysis |
| 12–18 months | Digitize high-risk service points with auditable trails (audit logs) | Government / digital | % of transactions with audit trail | PositionPaper |
| 18–24 months | Mid-term evaluation of reform outputs vs integrity signals | Government / (analytical) | Evaluation report published + revision actions | Official Extract |
(9) Focused conclusion
CPI 2024 places Egypt at 30/100 and 130/180, within a five-year path that fluctuates rather than steadily improves. Globally, the story is one of persistence: the average remains 43, and most countries score below 50—underscoring that anti-corruption is not a reputational add-on but a foundation for institutional capability, investor confidence, and public value delivery.
For ENCC, the practical next step is to treat CPI as a directional benchmark and translate its measurement scope into a measurable reform program: procurement/spending transparency, conflict-of-interest controls, whistleblower protection, and access-to-information improvements—tracked through concrete KPIs over 6–24 months, and assessed year-to-year by score rather than rank headlines alone.
Selected official references
- CPI 2024 Landing: https://www.transparency.org/en/cpi/2024
- CPI 2024 Report (PDF): https://images.transparencycdn.org/images/CPI2024_Report_Eng1.pdf
- CPI Methodology (ABCs): https://www.transparency.org/en/news/how-cpi-scores-are-calculated
Data notes & limitations (Mandatory)
- CPI is perceptions-based (experts/business), not a direct measurement of citizens’ lived experiences.
- CPI does not provide a standardized per-country “sub-component” breakdown; interpretation should be complemented by national/sector diagnostics.
- Rank is relative and can shift with broader country movements; score is the primary signal.
- Small annual changes may not be statistically significant; significance should be checked in the official results tables.
- Time comparability on the 0–100 scale is available since 2012; earlier editions are not directly comparable.
- CPI cannot, by itself, establish causal drivers behind Egypt’s movement, quantify illicit flows/money laundering, or measure private-sector corruption.