
Container Port Performance Index (CPPI) 2020–2024 – 2025: Global Performance Analysis ▸ Egypt’s Posi
Container Port Performance Index (CPPI) 2020–2024 – 2025: Global Performance Analysis
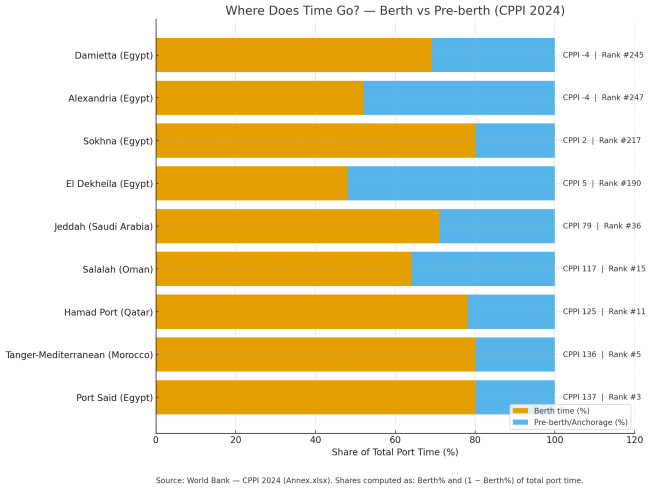
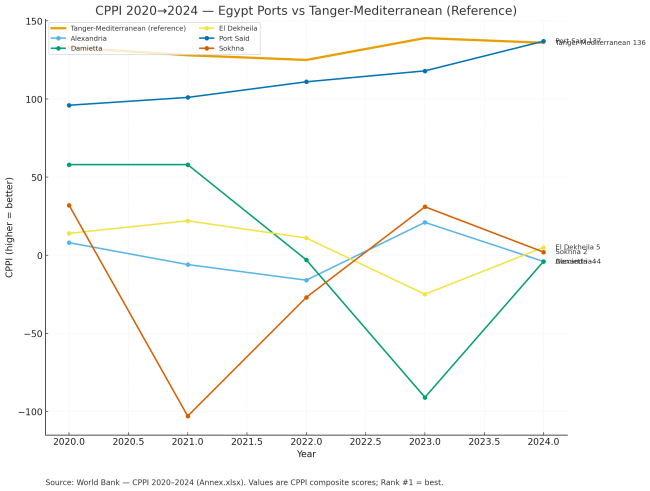
The CPPI provides an operational benchmark of port efficiency based on the ship’s total time in port (from arrival to berth departure), with comparisons normalized for vessel size and call size. Results draw on AIS and operational timestamps from major carriers, blending administrative and statistical lenses. The 2025 release covers 2024 data and tracks five-year trends 2020→2024, highlighting improvements following supply-chain disruptions. Global (2024): Continued rise of specialized ports with disciplined berth window management and just‑in‑time arrivals. Port Said leads domestically with a standout global outcome: #3 worldwide (CPPI=137, Δ23→24=+19, berth≈80%). Other Egyptian ports sit lower and vary significantly: El Dekheila (rank 190, CPPI=5); Sokhna (rank 217, CPPI=2); Damietta (rank 245, CPPI=−4); Alexandria (rank 247, CPPI=−4).Container Port Performance Index (CPPI) 2020–2024 – 2025: Global Performance Analysis ▸ Egypt’s Position ▸ Reform Roadmap
1. Overview
2. Data Card
3. Methodology & Dimensions (brief)
4. Global & Regional Trends
MENA references: Tanger‑Med within the top 5 globally (rank 5, CPPI=136, berth≈80%); Hamad (rank 11, CPPI=125); Salalah (rank 15, CPPI=117); Jeddah (rank 36, CPPI=79).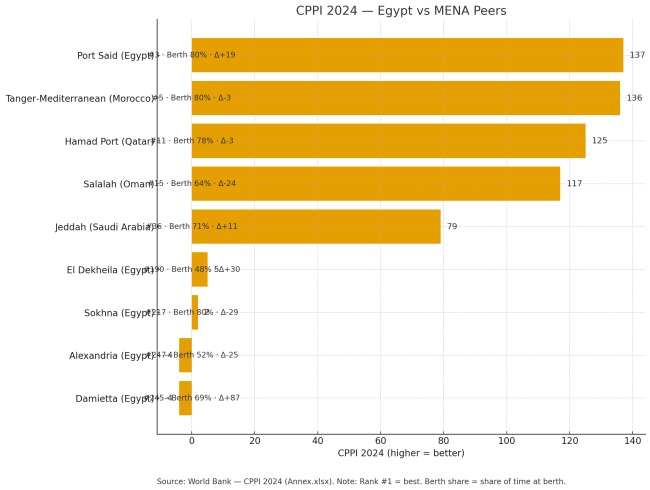
5. Egypt — Facts
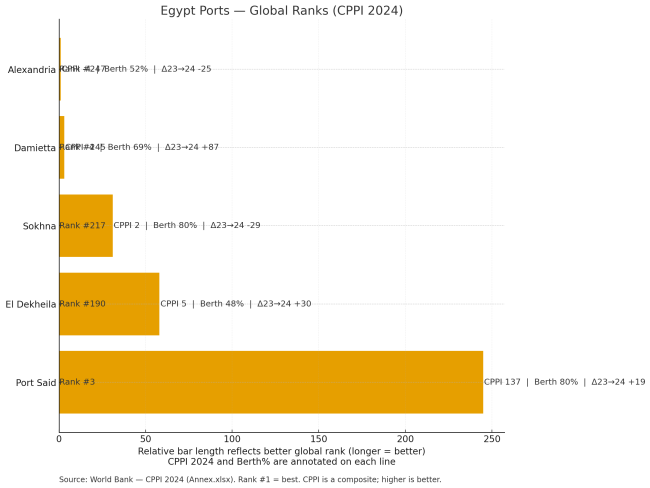
Table 1 — Egypt (2024 snapshot)
| Port | CPPI 2023 | CPPI 2024 | Δ 2023→2024 | Global rank | Berth share |
|---|---|---|---|---|---|
| Port Said | 118 | 137 | +19 | 3 | 0.80 |
| El Dekheila | -25 | 5 | +30 | 190 | 0.48 |
| Sokhna | 31 | 2 | −29 | 217 | 0.80 |
| Damietta | -91 | -4 | +87 | 245 | 0.69 |
| Alexandria | 21 | -4 | −25 | 247 | 0.52 |
Table 2 — Regional peers (MENA)
| Peer port | CPPI 2023 | CPPI 2024 | Δ 2023→2024 | Global rank | Berth share |
|---|---|---|---|---|---|
| Tanger‑Mediterranean (MAR) | 139 | 136 | −3 | 5 | 0.80 |
| Hamad Port (QAT) | 128 | 125 | −3 | 11 | 0.78 |
| Salalah (OMN) | 141 | 117 | −24 | 15 | 0.64 |
| Jeddah (SAU) | 68 | 79 | +11 | 36 | 0.71 |
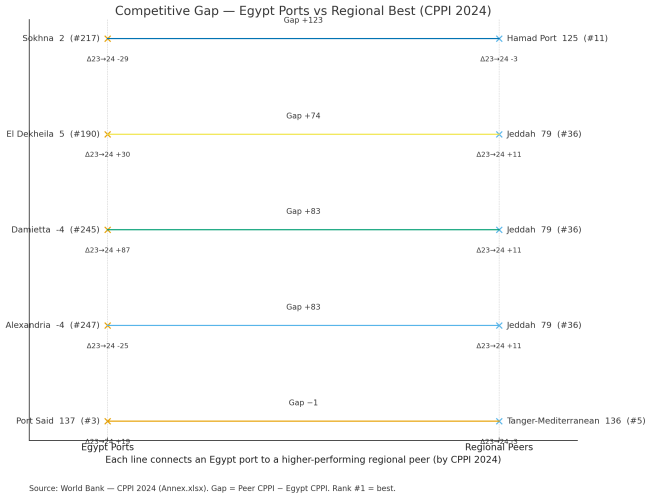
7. Performance Gaps & Priority Actions (Top 5)
8. Reform Roadmap (6–24 months)
| Action | Lead / partners | KPI | Timeframe |
|---|---|---|---|
| Implement JIT arrival and manage berth windows | Egyptian ports + shipping agents | Reduce P50 pre‑berth waiting (%) | 6–12 months |
| Align crane density to call size | Ports / terminal operators | Increase moves/hour (+X%) | 6–12 months |
| Activate PCS and integrate agencies | Port + Customs + Carriers | Cut document‑cycle time (−X%) | 12–18 months |
| Marine services coordination program | Ports + Pilotage/Tugs | Lower process time variance (−σ) | 6–12 months |
| Shock‑readiness plan | Ports + Crisis unit | Post‑shock recovery time (↓) | 12–24 months |
CPPI 2024 underscores Port Said’s excellence (#3 globally) and highlights actionable gaps elsewhere addressable through JIT, berth‑window management, crane alignment, and PCS. ENCC will track quarterly impacts and calibrate recommendations as the official annex updates.
9. Focused Conclusion
Selected Official References